Post-Pandemic Considerations, A VBC Series:
Potential Challenges Faced by Financial Institutions
Potential Challenges Faced by Financial Institutions
Posted in Covid-19, Insights, Liquidity Risk, Product Analytics, VBC Advisors
Haverford, PA, October 12, 2022
Deposit funding loss finally arrived
During the covid era, the additional stimulus liquidity flowing into depository institutions (and curtailed social entertainment spending by depositors) meant that reasonable margins remained despite low earning asset yields. Now, after five rounds of policy rate hikes to stem inflationary concerns (with even more expected to come) financial institutions are seeing visible drops in their deposit portfolios (see Chart 1 below). Thus, liquidity concerns have recently made a vigorous comeback into management meetings and board rooms.
CHART 1
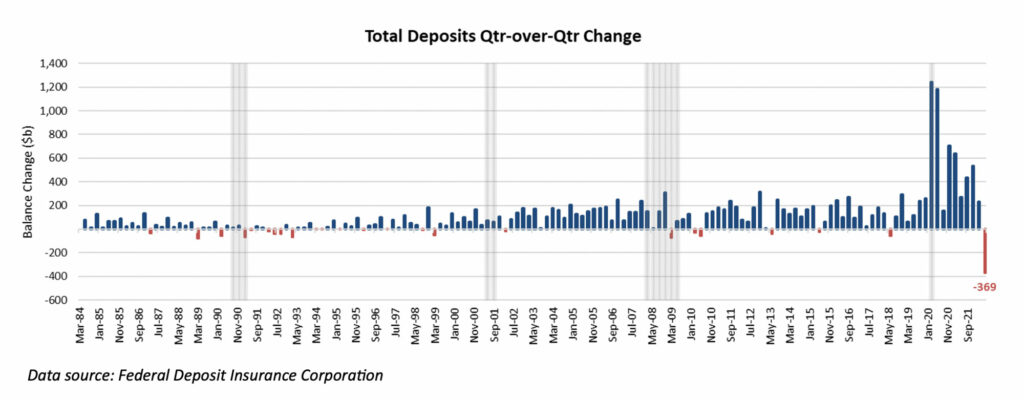
Chart 1 above also illustrates that concluding the second quarter of 2022, we saw a decline of an unprecedented $369 billion in overall deposits from FDIC-insured institutions. This magnitude of scaling back has not been seen in any of the prior post-economic recession periods. However, the counterpoint is that we have not had comparable deposit growth during any previous period, either. The sudden freeze of economic activities and the subsequent swift mitigation action adopted by the government (including the Federal Reserve) right after the pandemic injected over $3.3 trillion into the FDIC-insured depository institutions in 2020, and another $1.9 trillion in 2021.
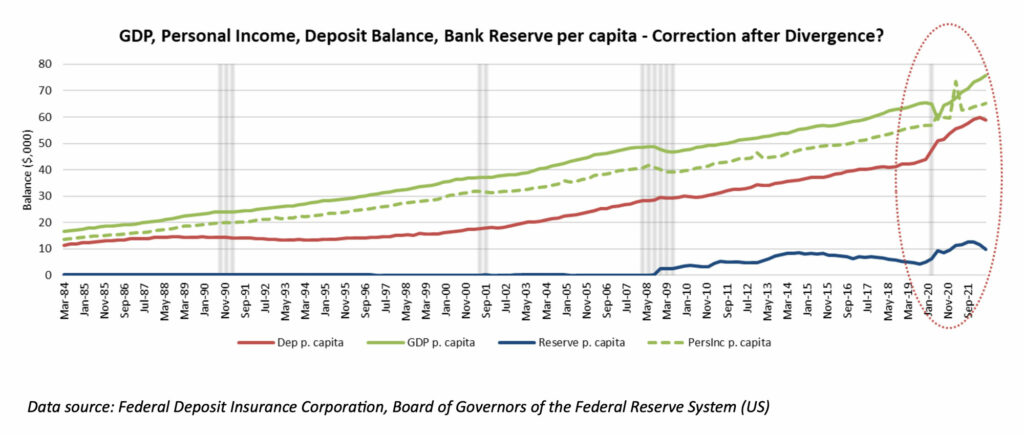
This unprecedented growth in liquidity through and after the pandemic, paired with the significant drop in GDP which, even after a “V” shaped recovery, never quite caught up with the monetary base growth, appears to have contributed to inflation. This situation, as pictured below in Chart 2, remains largely preserved even after we filtered out the impact of population growth.
CHART 2
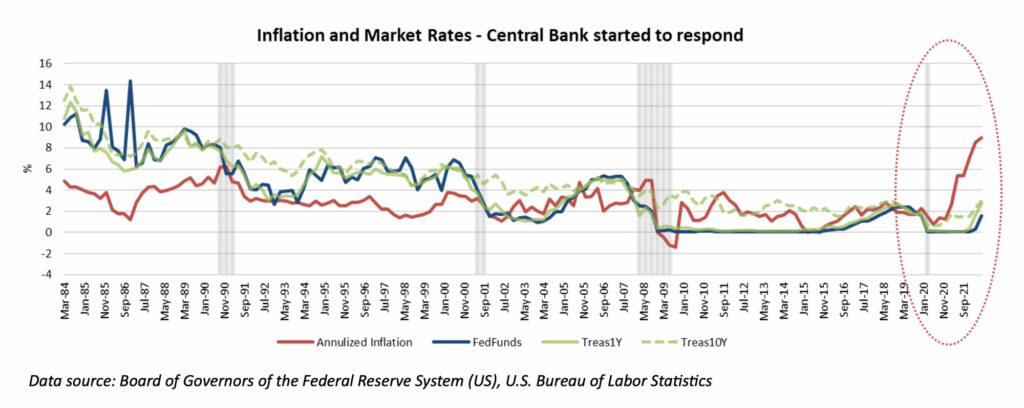
As a response to inflationary pressures, the Federal Reserve started to pull back the expansionary monetary policy, in the form of aggressively increasing its policy rates (see Chart 3 below), and actively cutting back the monetary base (see the trend in “Reserve” in Chart 2 above). The Q2 2022 $369 billion drop in the overall deposit level might be merely the start of the liquidity tightening process, and a monetary policy “correction”.
CHART 3
Who and which deposit products had the largest loss of funding?
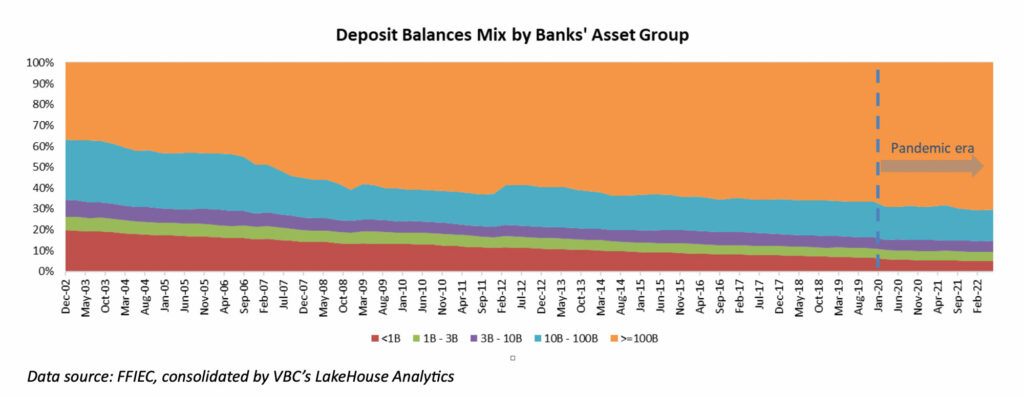
From recent history, the largest banks, which are defined as institutions with greater than $100 billion in asset size, had enjoyed the most significant total deposit balance growth since early 2020 and also experienced the most overall deposit decline during Q2 2022, as illustrated by the following Chart 4.
CHART 4
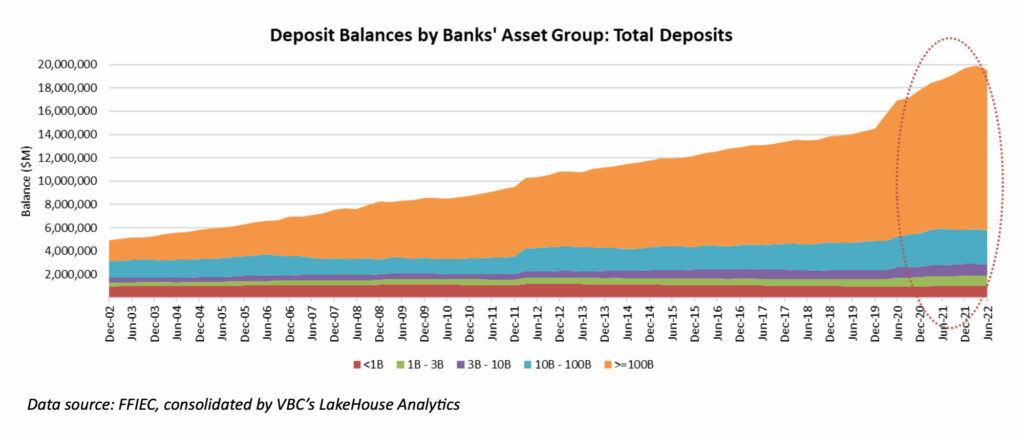
However, despite the recent decline in their overall deposit balances, the largest banks still retained over 70% of the total deposits as of Q2 2022 (see Chart 5 below), which is a roughly 4% increase from 2019.
CHART 5
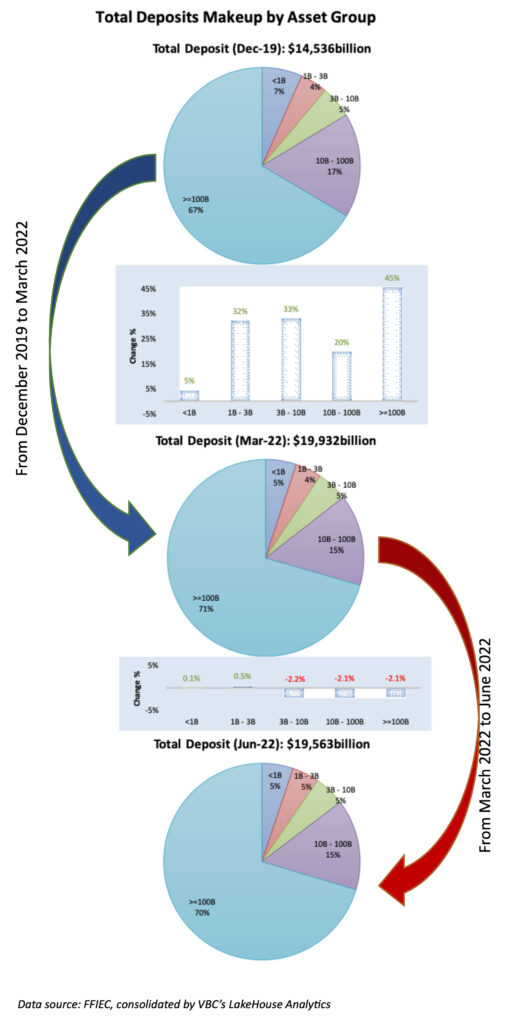
The graphs below show the progressive change in the overall balance among different asset groups at three highlighted time spots: (1) December 2019, (2) March 2022, and (3) June 2022. The magnitude of the balance decrease in Q2 2022 among the larger institutions was dwarfed by the significant balance growth during the Pandemic.
GRAPH 1
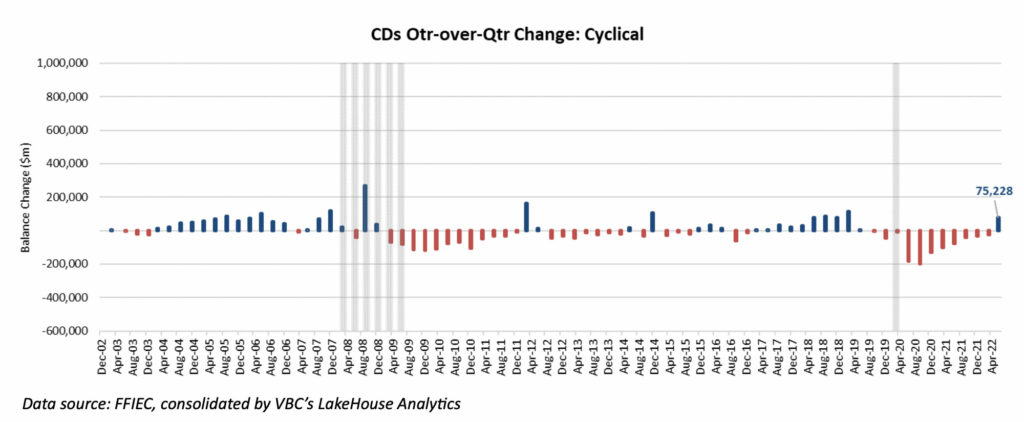
Among the different deposit products, MMDA & Savings (Chart 6) suffered the most loss of funding in Q2 2022; all the other deposit products, including DDA (Chart 7), NOW & ATS (Chart 8), and CDs (Chart 9), had actually increased. Notably, DDA and MMDA & Savings benefited the most from the expansionary monetary policy during the pandemic. This pattern could be the combined outcome of (1) near zero market/deposit rates, and (2) a large amount of the government “helicopter-dropped” money to both more financially sophisticated institutional customers and to less financially sophisticated retail customers. An additional consideration for deposit growth is related to the “flight to safety” effect, where funds tend to flow out of the stock market during economic downturns.
CHART 6
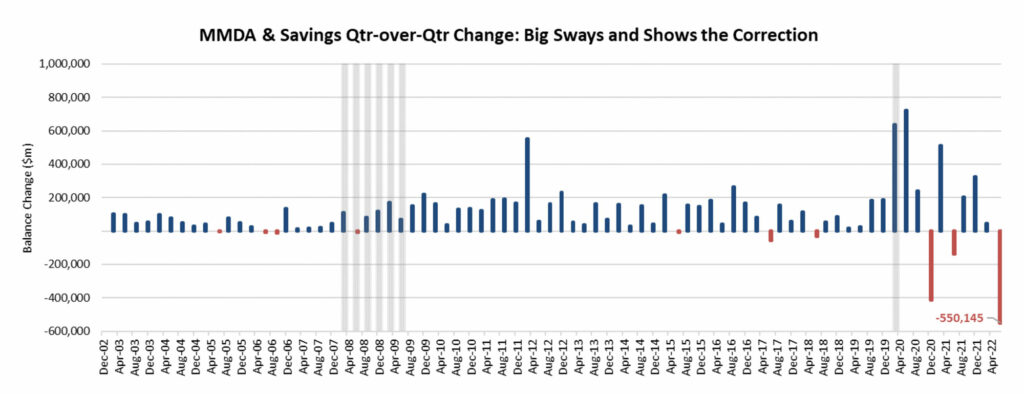
CHART 7
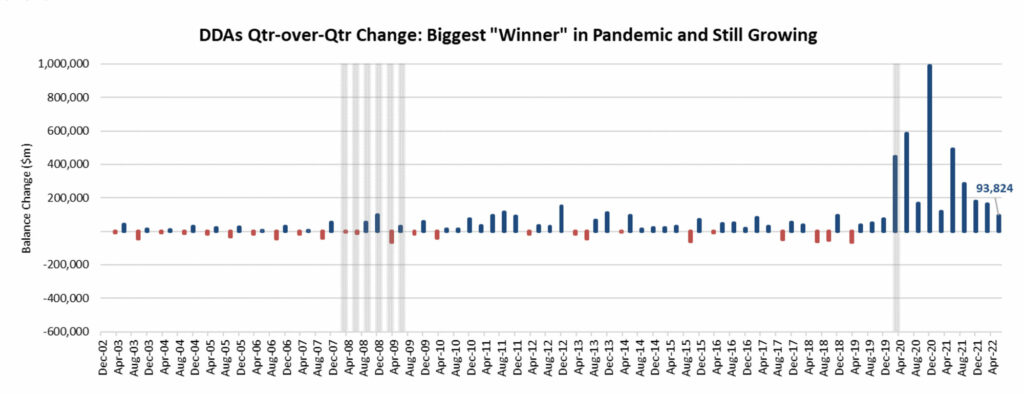
CHART 8
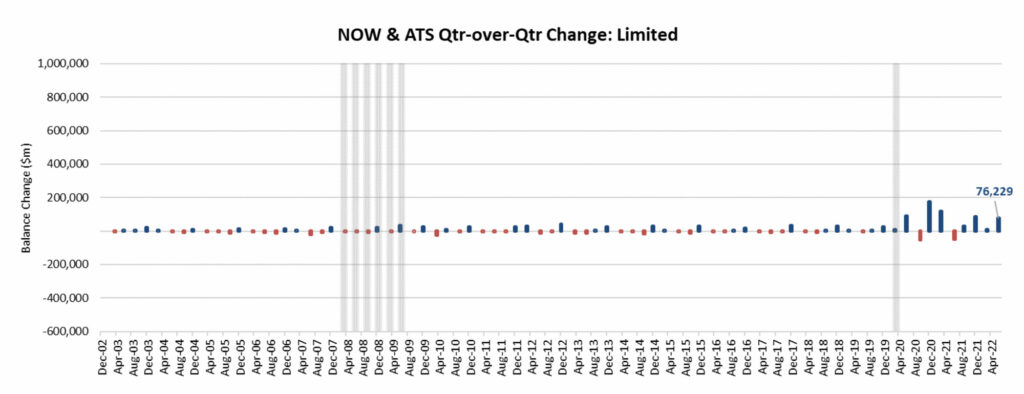
CHART 9
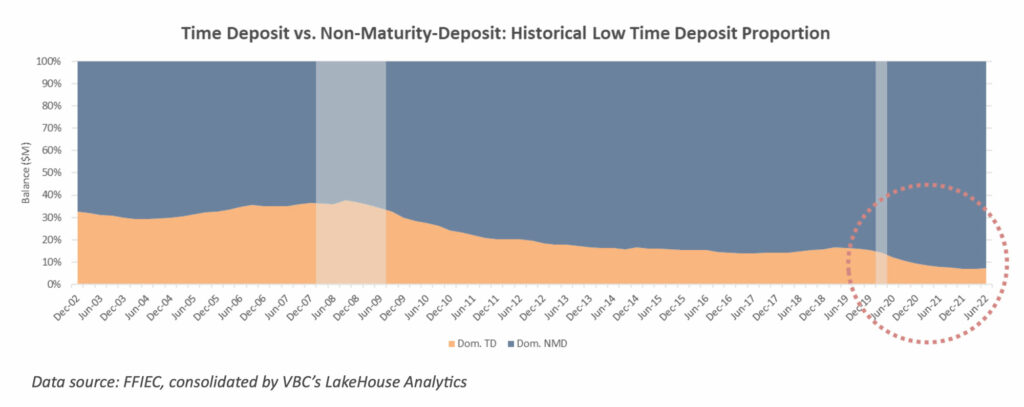
Since the early 2000s, time deposits’ relative importance (Chart 10) has declined especially during the prolonged low-rate environment after the Great Financial Crisis of 2008. As of Q2 2022, time deposits made up less than 10% of the domestic total deposit balance which is close to the historical low. As the market rate increases, the resurgence of time deposits should be expected as a logical outcome of the deposit customers’ rational response.
CHART 10
Compared to 2008, banks are in better shape
CHART 11
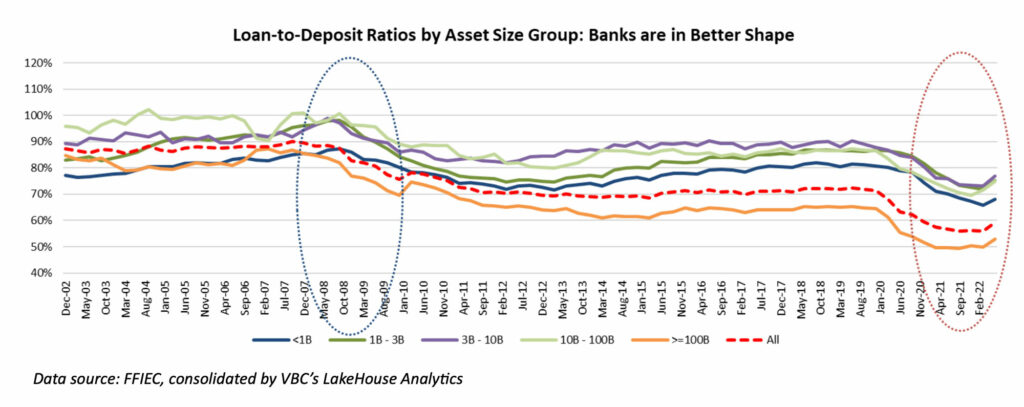
From the asset liability management perspective, on average, US financial institutions have significantly lower loan-to-deposit ratios currently compared to 2007-2009 (see Chart 11). Therefore, on one hand, higher cost funding reduction will boost the financial institutions’ profitability in the short-run ceteris paribus; on the other hand, given the trajectory of market rate changes and the looming recession, our financial institutions need to steer carefully, especially with regard to funding strategies.
Key: informed decisions
Where are you? Look through the lens of peer comparison.
Financial institutions are far from homogenous. They are operating in different markets (metro vs. rural, coastal regions vs. inland), at various scales/coverage (community banks vs. large national/international banks), and with different business models (business vs. retail). It is important for market participants to understand not only macroeconomic/general technological developments but also the dynamics among close competitors.
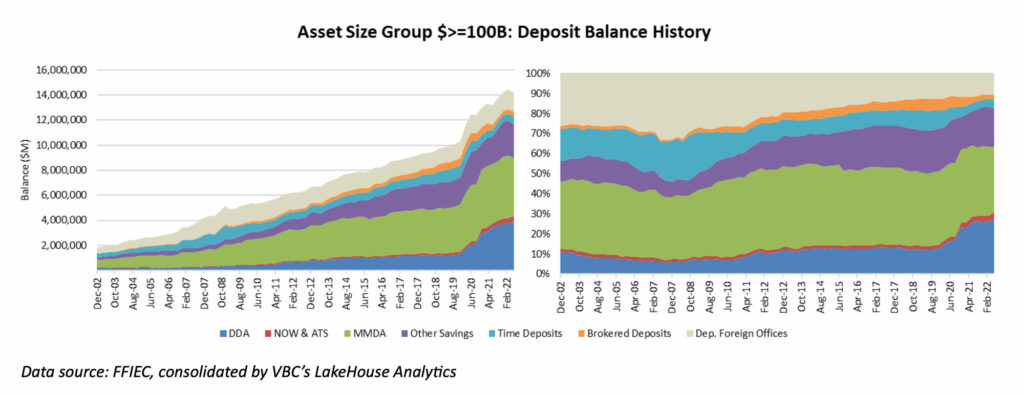
By merely dividing the FDIC-insured institutions into various asset size groups (see Charts 12 a through e), we can immediately see the differences in their deposit product makeups and the impact introduced by the Covid-induced recession. The following time series graphs of the aggregated deposit balances (by product type) across selected asset size groups show:
- The reliance on MMDA increases as the institutions become larger.
- The reliance on CDs decreases as the institutions become larger.
- Larger institutions – except for the banks with asset sizes north of $100B – tend to utilize brokered deposits more than the smaller ones.
- The greatest deposit funding growth during the Pandemic was observed among the largest institutions.
- DDA growth during the Pandemic was substantial across all asset size groups.
- Significant MMDA balance growth was seen primarily among the larger institutions.
CHART 12A
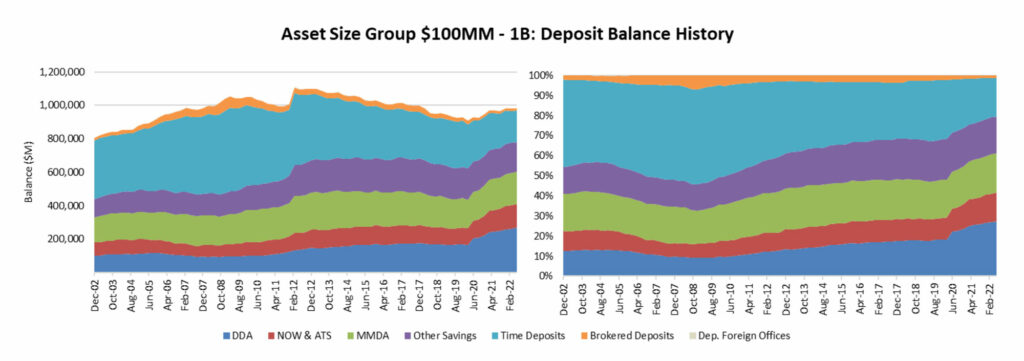
CHART 12B
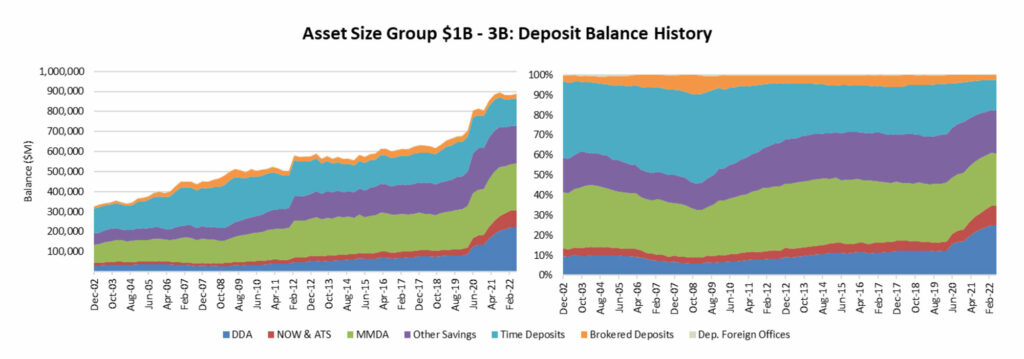
CHART 12C
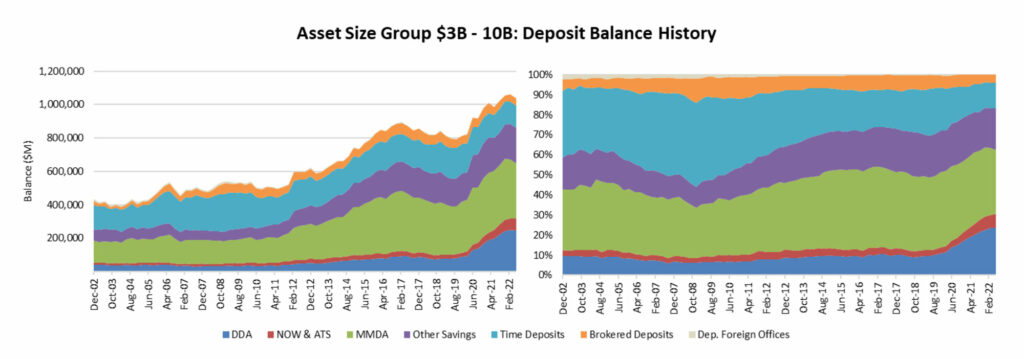
CHART 12D
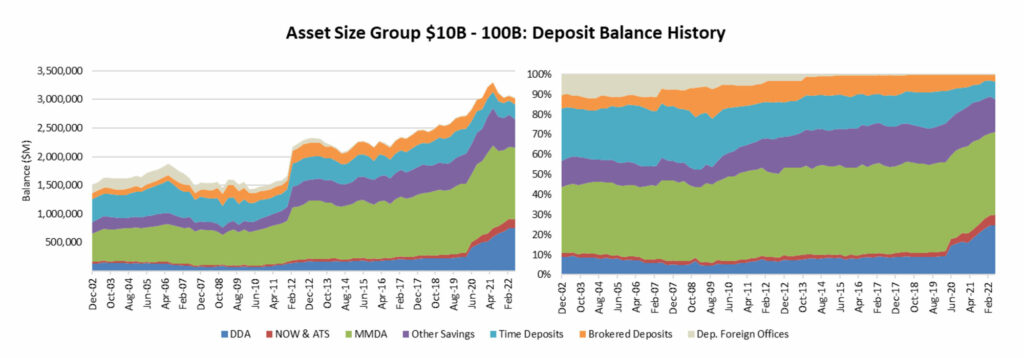
CHART 12E
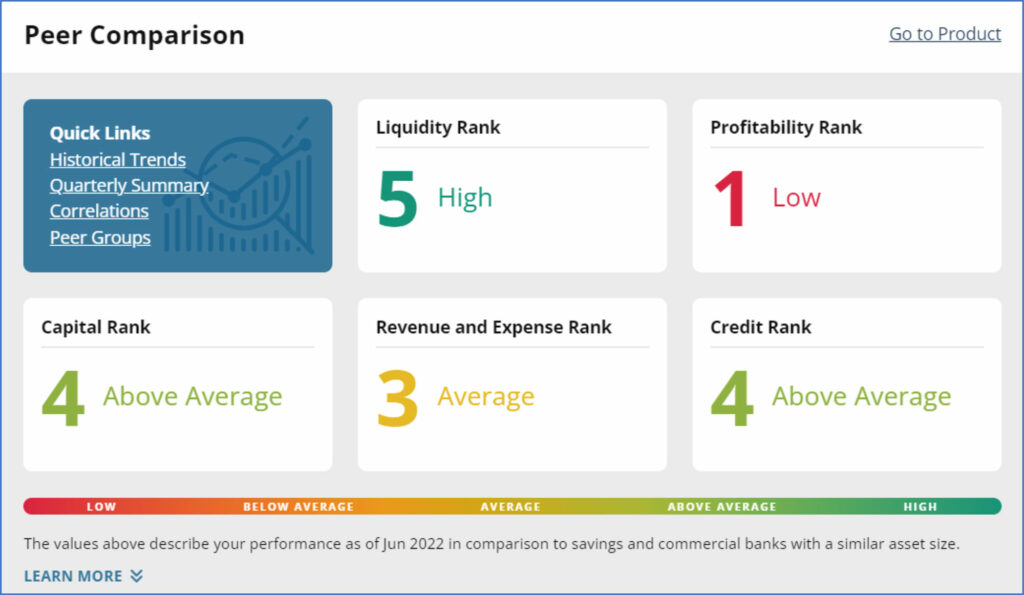
One key tool to examine historical comparisons and balance sheet profiles is to utilize peer comparisons. VBC’s LakeHouse Analytics provides an intuitive, quick, and effective tool that provides an overview for you to gauge where you are compared to selected peers (https://lakehouse-analytics.com/learn). It is based on Call Report data stored in the FFIEC database. Below is a sample institution’s snapshot of quintile rankings by “risk rooms”.
Know your products and your customers
To properly maintain funding sources is to properly maintain funding relationships. Product design is stemmed from the institution’s business model and is tailored to the needs of the targeted deposit customers. An accurate understanding of your customers is paramount to funding management.
Given the uncertainties at hand, important questions include:
- Who brought the surged balances during the pandemic?
- Among the customers identified in #1, who cares more about the rate of return on their funds?
- How did the customers identified in #1 and #2 react to the historical rate hikes in the past if we have their history?
- How will they likely respond to this round of rate hikes based on their historical behavior?
- What had changed in my customer base and what are its implications for my future deposit shift?
With properly collected data, Behavior Modeling Specialists from VBC Advisors could assist you with these questions. A deepened understanding of your customers will provide the ground for appropriate “what-if” scenario designs, which can not only satisfy regulatory requirements but also serve as a meaningful management tool.
What does the future look like? Are you prepared?
In the best-case scenario, banks’ balance sheet profiles will return to similar proportions seen in 2019. However, this assumption suggests that the economy and accompanying rates reemerge or return to ‘equilibrium’.
Currently, the market appears not to agree with this hypothesis and has built-in at least a 75 basis point increase in Fed Funds, with the long end of the curve inverted. Therefore, expectations that this Fed-tightening cycle will manage to thread the needle of both curbing inflation and not causing a recession is in doubt. A soft landing may be wishful thinking.
Thus, three series of issues must be closely monitored: liquidity, margin compression, and a potential credit cycle. Banks must conduct stress tests for each of the above, and in combination, revisit their Strategic Plans and Budgets. By assessing and testing your own specific risks and sensitivities, especially with regard to loan growth, deposit retention, available lines of credit, and appropriate product pricing, you will be able to achieve your income and growth targets.
This article is the opening to our series regarding post-pandemic financial opportunities and challenges. Stay tuned for the next part of our series, Liquidity Risk. There, VBC will discuss how you can prepare your institution to meet these challenges and answer the following questions: How do we measure liquidity? What types of stress scenarios should we run to ensure we can withstand significant shocks? How available are our sources of liquidity when we are in a stressful situation? And, finally, is our Contingency Funding Plan up to date and adequate to meet any challenges in the future?
Della Zheng Ph.D.
Della is VBC’s Director of Applied Quantitative Analytics. In her role, Della delivers expert support and leadership for VBC’s deposit and loan analytics solutions and is a core contributor for specialized consulting engagements under VBC Advisors, while also providing expertise for advanced model validation engagements and deliverables.
What's the potential cost of not leveraging the experience, tools, and talent VBC brings to the table?