Liquidity, From Feast to Famine
Posted in Insights, Liquidity Risk
Haverford, PA, March 15, 2023
Over the past several years financial institutions have been flush with liquidity while interest rates were at historic lows. The liquidity feast was perpetuated by the massive fiscal stimulus, the PPP loan program and the lack of consumer and business spending. Throughout the first 18 months of the pandemic the banking industry saw deposit growth that exceeded the prior 8 years of growth. This resulted in a massive amount of liquidity on their balance sheets at a time when rates were at historic lows. Most institutions invested their excess liquid funds into the investment portfolio rather than let the funds earn a near zero yield. To achieve this respectable yield they extended the duration of those investments (effectively increasing their interest rate risk). This was the story at the majority of institutions throughout 2020 and 2021.
Fast-forward to the end of 2022 and we begin see liquidity tighten as the fed funds rate breached the 3.5% level. Consumers and businesses start doing several things; tap into their excess funds to meet the demand of rising prices, push their deposits into higher yielding accounts or into alternate investments, or service higher borrowing costs. Last week the result of this strategy laid the groundwork for the unwinding of Silicon Valley Bank (SVB) starting with about $42 billion of panic-inspired deposit withdraws on Thursday March 9th and ending with the FDIC closing the institution on Friday March 10th.
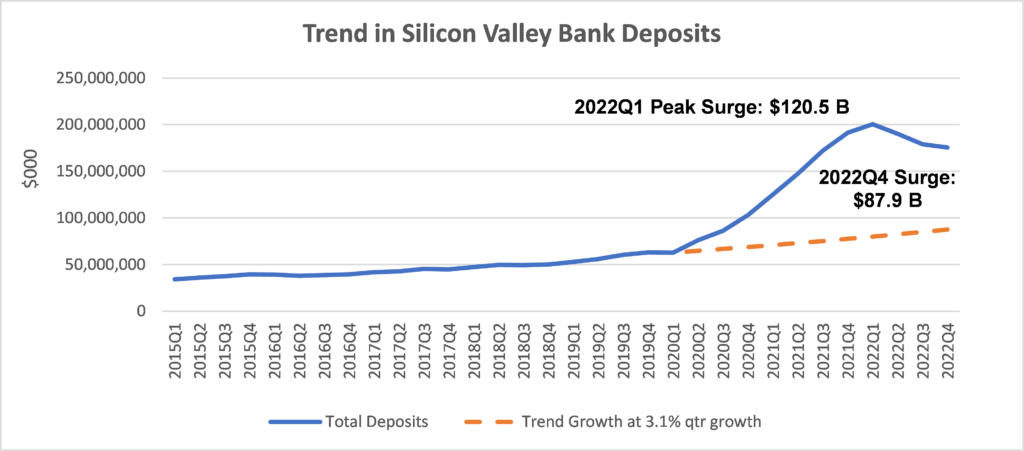
Let’s take a quick look at how this strategy played out for SVB by their numbers. Throughout 2020 and 2021 SVB’s deposits grew by a quarterly average growth rate of 13.5% and 16.8%, respectively. This growth far surpassed its average quarterly growth rate of 3.1% over the past five years. By the 1 Quarter of 2022 SVB’s deposits peaked at $200.4 billion, 3.2 times its deposit level in 2019. We estimate that the surge in deposits for the 1Q of 2022 was $120.5 billion, or 60% of total deposits. This level of surge was much greater than the 12.6% for the banking industry.
Not only did SVB see a tremendous surge in deposits, but its deposit base was also heavily weighted to large uninsured deposits exceeding the $250k FDIC deposit insurance funding limits. At the end of 2022, SVB’s estimated uninsured deposits accounted for 86% of its total deposits. This level is much greater than the industry average of 35%. The high concentration of uninsured deposits coupled with the ease of moving money in the digital age paved the way for the crippling outflow of deposits that was to come.
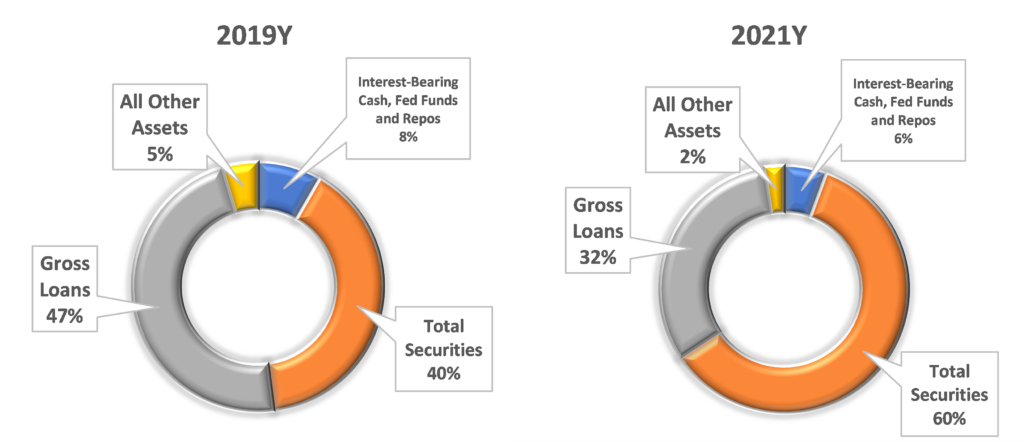
Like most institutions during 2020 and 2021, deposits growth far surpassed loan growth. SVB grew its loan portfolio by $33 billion between 2019 and 2021, well below the $128 billion in deposit growth during that time. The gap between the loan growth and the deposit growth was put to work in the investment portfolio. In fact, the investment portfolio grew to be 60.1% of assets by the end of 2021 from 41.1% at the end of 2019. In order to capture yield, SVB reached out to the longer end of the yield curve (buying longer term investments). Furthermore, SVB classified most of its investments (78%) as held-to-maturity (HTM), which enabled them to hold the securities at their cost base and not show the unrealized loss in AOCI.
As mentioned previously, this strategy was played out at many financial institutions across the country. And in 2022 when the Fed began to raise rates to combat the ever-increasing inflation the strategy began to unwind with deposits leaving the institution and concurrently the security portfolio’s value deteriorating.
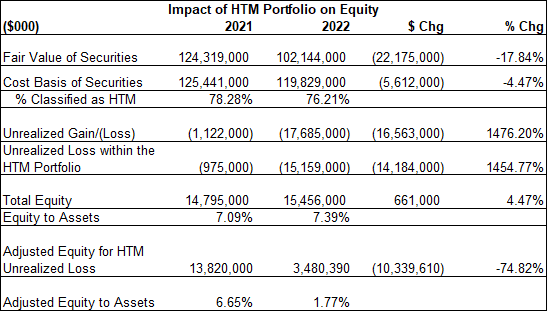
The following table shows that by the end of the 2022, SVB lost $16 billion in deposits (8.6%) and the unrealized loss of its investment portfolio was $17.7 billion. However, $15 billion of the unrealized loss was not reported in the AOCI as it was attributed to bonds classified as HTM. This was a major issue as SVB reported just $15.5 billion in total equity at the end of 2022. We estimate that SVB equity to asset ratio would have fallen to 1.77% from its reported level of 7.39% at the end of 2022 when you include the after-tax unrealized loss. A seriously low level.
During the first two months of 2023 SVB saw its deposit outflow increase while its bond portfolio continued to decline in market value. The escalating deposit outflow resulted in a liquidity stress that mandated the institution begin to sell its bond portfolio at a significant loss, turning the unrealized losses into realized losses. We will not know the full extent of this loss until we see the final financial statements when they are released by the FDIC. However, it has been reported that on Thursday the 9th of March there was a $42 billion run on SVB’s deposits.
VBC estimates that there are at least 84 institutions that fall below a 2% equity to asset ratio when factoring in the full unrealized losses at the end of 2022, including HTM. Given the FDIC’s closure of SVB, and subsequently, New York’s Signature Bank 2 days later, presumably for similar reasons, all institutions should be taking a hard look at their liquidity situation and stress testing to evaluate if they have the level of liquidity needed to weather this storm.
If there’s one thing we learn for the fallout of SVB it’s that the severely adverse liquidity stress scenario can actually come to fruition and that can come quickly. Did SVB run this type of scenario in its liquidity stress test? If so, did it use the appropriate assumptions for the devaluation of the bond portfolio and the reduced wholesale funding availability given the increase in interest rates or the rapid rate of deposit runoff due to the high concentration of uninsured deposits? Additionally, a deposit study would show the concentration of depositor type.
VBC has helped many institutions put in place robust liquidity stress testing programs that essentially played out this exact scenario and deposit studies to help institution’s manage interest rate risk. If you need help setting up a robust liquidity stress testing program or need assistance in fine tuning your assumptions give us a call.
What's the potential cost of not leveraging the experience, tools, and talent VBC brings to the table?